Friday, July 26, 2024
THE WORLD INDEX ACWI 28 JUNE TO 16 AUGUST 2024: 7/15/14 DAY :: Y/2-2.5Y/2Y 1929 -LIKE CRASH
The ACWI world composite, unadjusted for inflation, peaked in July 2024. The index is in the lineage of the US hegemonic 1807 36/90/90/54 year great x/2.5x/2.5x/1.5x four phase Fractal Series ending in 2074 with progenitor nadir valuations in 1842-43, 1932 and with an inflation adjusted peak in 2021.
From 1932 US equities followed a 10-11/21-22/21-22 year fractal series :: x/2x//2x ending in 1982 with high Volcker QT fed fund rates that have since cascaded lower and lower and post the 2009 global housing bubble have collapsed to near zero.
Low inflation during this low interest rate period was facilitated by imported low cost manufactured goods from China, use of natural gas as an energy source, and fracking which elevated US oil production and export to levels not seen in decades. During Covid large % GDP deficit spending, 2.5-3% mortgage rates, supply line disruptions, and corrupt corporate price fixing produced a 10% inflation rate. In response the US central bank invoked Volcker-like QT with an inversion of short term -long term bond yields that has lasted more than 600 days, longer than the inversion leading up to the 1929 crash.
The observed fractal series since 1982 is 13/31 of 32 years with an expected large scale 2024-2025 second fractal crash. (See main page of the Economic Fractalist). This is part of a 13/32/32-33/20 year :: x/2.5x/2.5x/1.5 x series ending in 2074. The third 32-33 year fractal starting in 2025 will see the greatest monetization of national debt and social contract liabilities in world histor.
The yearly fractal series groupings since 1982 can be observed using the SPX. The first 13 year fractal is composed of a 3/7/5 year series ending in 1994. The second fractal is composed of two series: 3/7/7 years and 4/8/7 of 8 years ending in 2025.
The terminal portion of the 1994 current 31 year second began in March 2020 and follows a 8-9/24/23 month :: x/2.5x/2.5x fractal growth sequence peaking(unadjusted for inflation) in July 2024. The 23 month third fractal of the 8-9/24/23 month series is composed of a 5/10/10 month series. The third 10 month series started in October 2023 and is composed of a 13/28 0f 32 week :: 59-60/149-150 day series expected to end on about 16 August 2024. This is the incipient 13/31 of 32 year 1982 31-32 year second fractal crash.
A Comparison of the underperforming French CAC,(now below its recent 6 month average)with the better performing world composite ACWI which contain US, Japanese, and Indian stocks is useful in defining the final daily fractal decay series which appears for the ACWI to have started on 28 June 2024 and is composed of a 7/13 of 16-18/14 day :: y/2-2.5y/2y series ending on 16 August to 20 August 2024. Like the 11/26/28 day :: y/2.5y/2.5y decay series occurring in 1929, a significant rebound of global equities is expected to occur beyond the early November 2024 US presidential elections.
Added 27 July 2024:
An alternative crash fractal pathway ending 20 August 2024 is observable: a 28 June 224 3/7/6 day growth pattern which peaks on the day 2,3, and 4 of the final 11 July 6 day third fractal and ends lower with a valuation lower than day 1 of the 6 day fractal series . This 11 July 2024 6 day sequence of final growth and decay becomes the first base fractal for a 11 July 6/12/12 day :: y/2y/2y crash decay fractal series ending 20 August with possible y/2-2.5y/1.5-2.5y decay fractal variations.
Added 28 July 2024
A third alternative for a quantitive mathematical fractal blow-off growth from 28 June 2024 for the World Equity Index ACWI is a 4 phase fractal blow-off series from 28 June 2024 of 2.5/5/5/4 days :: x/2x/2x/1.5x. The final 4 day 4th fractal in this series starts on 15 Jul2024 and contains the all time ending peak valuation on 16 July 2024.
This 15 July 4 day 4th fractal in the 28 June 2.5/5/5/4 day 4 phase series become the base for a 4/10/10 days :: y/2.5y/2.5y crash series ending 13 August with a possible lower low extension of 6 days 4/10/10/6 days :: y/2.5y/2.5y/1.5y ending on 20 August 2024.
Monday, July 15, 2024
The elegant saturation fractal self-assembly growth and decay of the asset-debt system’s composite equity valuations- the DAX: 125 of 149-150 day second fractal decline.
Fractal self-assembly and self ordering of asset valuations, traded daily (or five times a week), occur in combinations of three and four phase mathematical fractal series: x/2-2.5x/2-2.5x/1.5-1.6x and x/2-2.5x/1.5x-2.5x, where x denote a fractal time unit in days, weeks, months, and years.
An alternative 149-150 day DAX 17 January 2024 second fractal decay model of the 23 October 2023 60/125 day of 126 to 150 day first and second fractal series has no flash crash, rather a 14 July 2024 6/12/9-10 day :: x/2x/1.5-1.6x decay series ending 15-16 August 2024.
The current model for the DAX and western equity composites from the March 2020 covid low is an averaged 8-9/23-24/23/1 of 12-15 month :: x/2.5x/2.5x/1.4-1.6x four phase growth and decay fractal series.
The expected June- Sept 2025 low for global equities represents the end of a major consumer-citizen 1982 13/32-33 year debt-dependent credit cycle, where asset prices in the terminal 32nd/33rd year of he second fractal particularly, global residential asset and equity prices will fall precipitously and debt default and restructuring will occur, forming the basis for another 30-33 year inflationary credit expansion.
The expected incipient August September 2024 Fed fund rate cuts and mid August 2024 149-150 day second fractal nadir valuation saturation selling would provide two explanations for rebound valuation growth beyond the incidental US November 2024 election cycle.
Saturday, July 6, 2024
The July 2024 Global Flash Crash: The DAX 23 October 2023 to 5 July 2024 13/25 of 25-26 week :: 60/120 day :: x/2x First and Second Fractal Series: In the Fractal Asset-Debt Macroeconomic System, Incipient Fractal Valuation Growth Begins in Terminal Fractal Decay
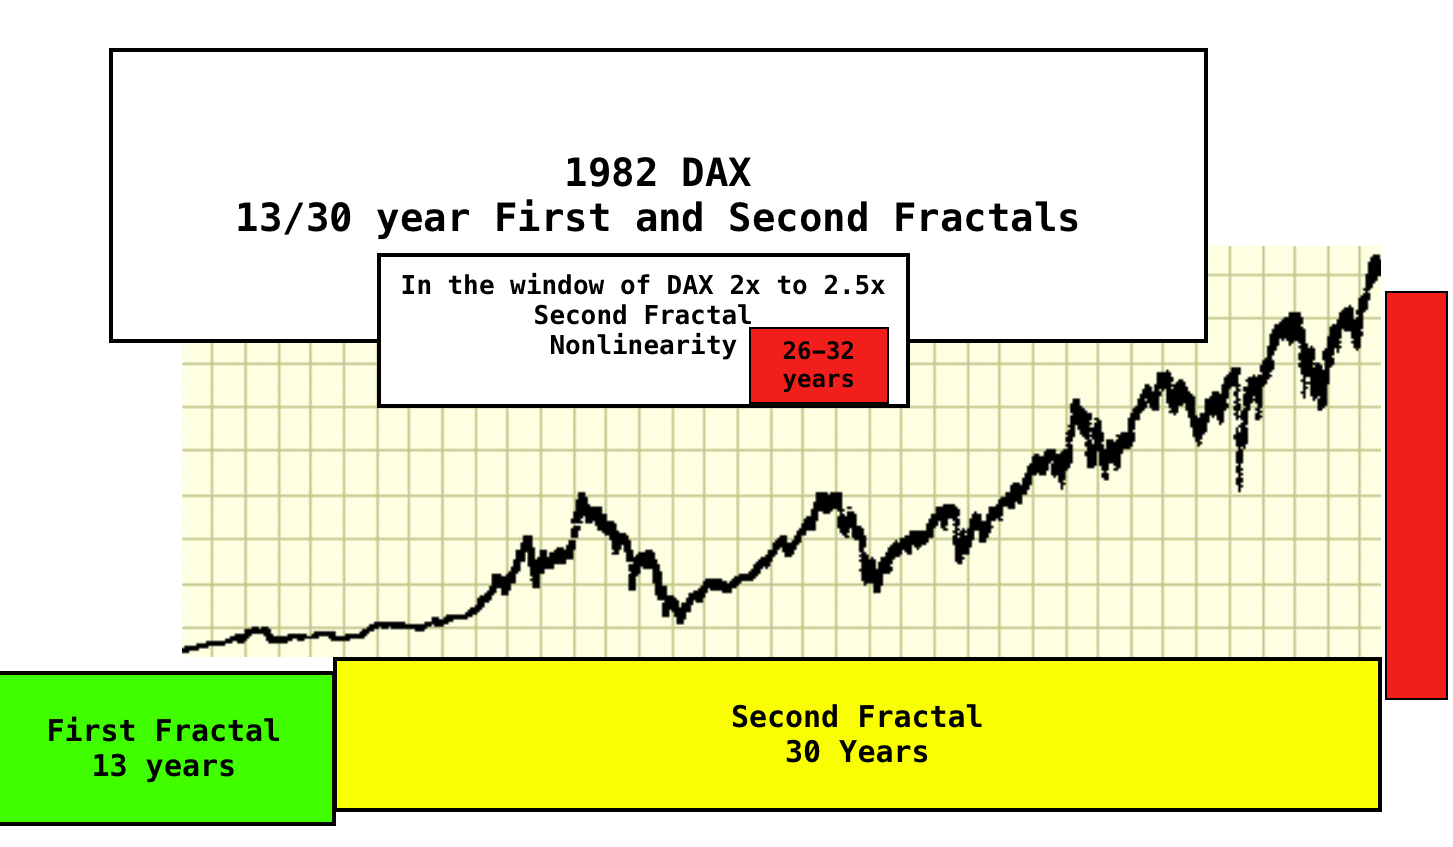
The 1982 -2024 German DAX 13-14/30-31 year First and Second Fractals
Within the 4-phase 267 year 1807 to 2074 US hegemonic x/2.5x/2.5x/1.5x :: 36/90/90/54 year fractal series, rests an interpolated 1982 German DAX 13-14/30-31 year series. The 30 year second fractal nonlinearity could as an incipient feature have an initial shocking flash crash (with a sharp rebound beyond the November 2024 election.
The self-assembly fractal mathematical architecture of the 23 October 2023 to 5 July 2024 x/2x :: 13(-)/25-26 week :: 60/120 day fractal series is observable. Rather than 28 October 2023, the Incipient day for the 13-/25-26 week first and second fractal series is 23 October 2023 consistent with the fractal maxim that fractal valuation growth begins in terminal fractal decay. Objectively, a 13(-)/25 week first and second fractal series can be identified from 23 October 2023 to 5 July 2024. The first 13 week fractal occurs as a 3/7/5 week fractal series(x/2-2.5x/1.6x) and the second fractal, a 5/10/12 of 12-13 week fractal series x/2x/2.4x-2.5x. Next trading week, the 23 Oct 2023 x/2x series with a base (x) of slightly less than 13 weeks will be in the window (2x to 2.5x)of 26-32 week second fractal nonlinearity.
As of 5 July 2024, a 23 October 2023 60/120 day :: x/2x first and second fractal series is observable. The terminal fractal window begins next week between day 121 and day 150.
The Dax is at/near its March 2020 third fractal apogee with a three phase fractal growth series of 8/24/23 months as of 5 July 2023. (see below.)
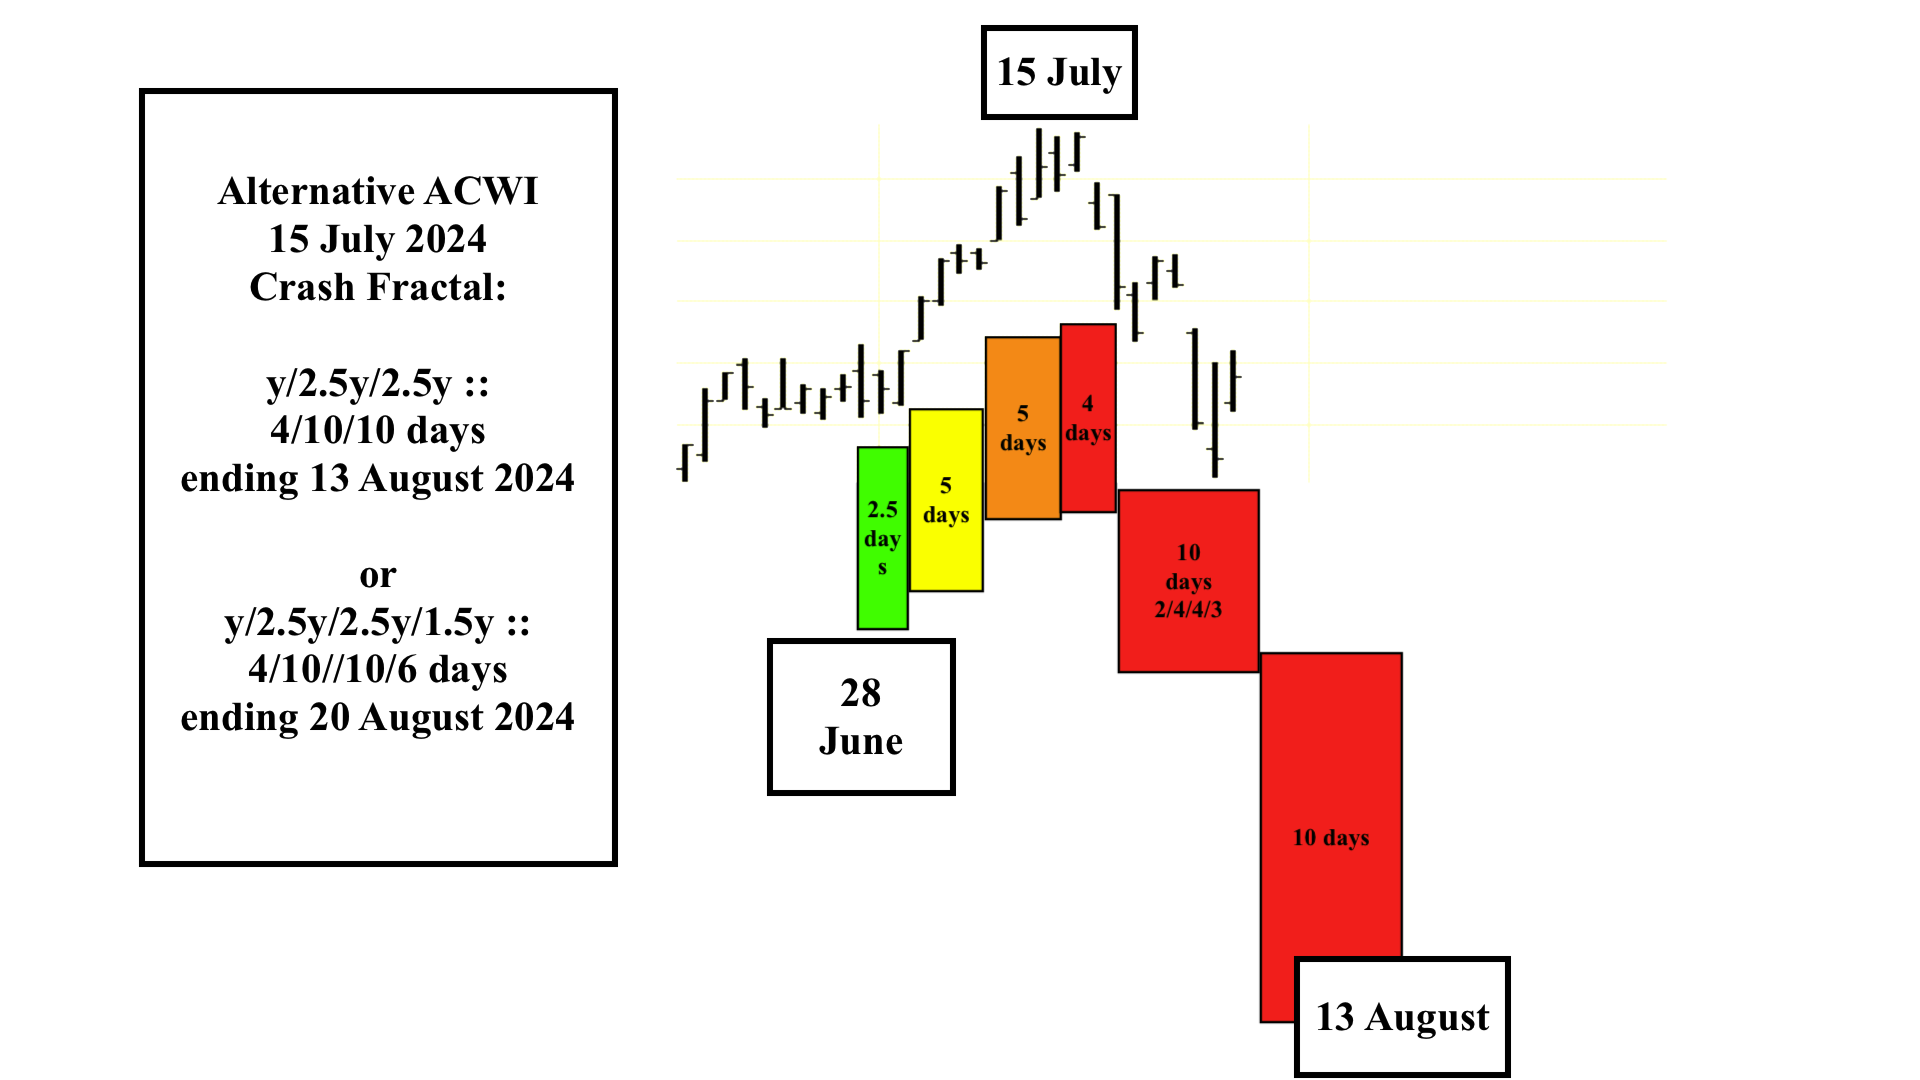
The extended second fractal of 24 months or 4/9/8/6 months :: x/2-2.5x/2x/1.5x is beyond the expected 2.5x or 20 months of the 8 March 2020 base fractal because of the extraordinary QE in 2020-2021 with the Fed adding 10-11 trillion dollars to their balance sheet or a historical 30 % increase in the GDP/national debt ratio in just two years. The last 5/10/10 month third fractal takes the DAX to its July 2024 lower high with a potential high next week completing a 4/10/6-10 day:: x/2.5x/1.5-2.5x 3-phase growth fractal series.(see the final green/yellow/orange 4/10/4 of 4-10 day growth series above).
From the 2005 main page of the Economic Fractalist regarding the nonlinearity of second fractals: The ideal growth fractal time sequence is X, 2.5X, 2X(to 2.5x) and 1.5-1.6X. The first two cycles include a saturation transitional point and decay process in the terminal portion of the cycles. A sudden nonlinear drop in the last 0.5x time period of the 2.5X is the hallmark of a second cycle and characterizes this most recognizable cycle. After the nonlinear gap drop, the third cycle begins. This means that the second cycle can last anywhere in length from 2x to 2.5x. The third cycle 2X is primarily a growth cycle with a lower saturation point and decay process followed by a higher saturation point. The last 1.5-1.6X cycle is primarily a decay cycle interrupted with a mid area growth period. Near ideal fractal cycles can be seen in the trading valuations of many commodities and individual stocks. Most of the cycles are caricatures of the ideal and conform to Gompertz mathematical type saturation and decay curves.
Wednesday, June 26, 2024
A June/July 2024 Flash Crash?
Second Fractal Nonlinearity
Why did significant one day crashes occur on 19 Oct 1987 and on 6 May 2010? What news precipitated these events? The explanation of Fractal Macroeconomics is that both occurred in the terminal 2x to 2.5x window of second fractals, when nonlinear price devaluations can occur in saturated oversold markets. 1929 to 1932 occurred at the end of a US hegemonic 90 year second fractal occurring as a 36/90 year series starting in 1807.
Currently, this is year 31 of a 13/31-33 year 1982 first and second fractal series and day 113-114 (for the SPX and DAX respectively) of a 56/112-140 day October 2023 first and second fractal series. The system is in the terminal 2x to 2.5x second fractal windows. For the Wilshire 25 June 2024 did not exceed its 18 June 2024 nominal peak but did serve as a secondary near peak valuation of a 8/24/22 month fractal growth series from the March 2020 low.
The asset debt system is in the 2x to 2.5x time window of both the 1982 and Oct 2023 second fractal nonlinearity.
Will there be an incipient (and AI propelled) flash crash?
US total market cap to GDP ratio was at 192.2 % on 24 June 2024, still 7% below its 2021 199.5% peak.
Since 2020 profoundly and historically aberrationally high deficit borrowing and spending (as a % of GDP) by central banks, governmental, and private sources – has produced relatively so little GDP.
Expect the unexpected.
Wednesday, May 22, 2024
1637, 1720, 1929, 2000, 2007 and now 2024 What name will be given to the May 2024 US Peak Equity and Peak Gold in USD global asset valuation collapse?
In the asset debt macroeconomic system what is the worst bubble element - an asset overproduction and overvaluation bubble or an unsustainable debt overproduction bubble at the consumer base of the asset-debt economic pyramid? While the two elements are closely linked, each of two might be individually assessed for comparison at peak system valuation of commodities and equities at prior asset peak valuations :1637, 1720, 1929, 2000, 2007, and now in 2024.
Qualitatively of these climax years 2024 is arguably the worst of the extremes of both global overproduction and overvaluation of assets and overproduction of consumer unsustainable debt. China, the second leading economy, has a collapsing consumer owned housing market with awful inactive parameters of a declining population, falling prices and 50-100% unoccupied residentials. With the early 2020-2022 historically low US mortgage interest rates and MBS's inflating US residential valuations by 14 trillion dollars, and later in 2023 and 2024 with mortgage interest rates at 20 year highs, the global leading economy has its consumer housing prices both at historical high valuations and representing 5-6 times annual median wages for new purchases. US consumer credit card, college, and mortgage debt are at likewise historically high percentages of median wages. Vehicle repossession rates, the litmus test of the fragility of the consumer based economy, are rapidly climbing as consumers cannot pay interest and principal on car loans.
And while sovereigns can print money to monetize their national debt, individual citizen consumers cannot.
In May (not April) 2024, gold in USD completed a year 2000 51/128/102 month :: x/2.5x/2x peak valuation growth fractal with gold peaking at 2454.20 dollars on 20 May 2024.
Gold’s monthly long term peak valuation in US dollars and the concurrent Wilshire valuation May 2024 peak suggests that May 2024 is a global valuation peak for the global asset-debt macroeconomic system.
From the May 2024 gold in USD and Wilshire peak valuations, valuations of global equities, commodities, and cryptocurrencies will significantly fall from the twin bubbles of global overproduction of assets and unsustainable consumer debt loads.
Sovereign debt instruments will appreciate as sovereign interest rates fall in a global recession.
Tulip, South Sea, Roaring Twenties, Internet, Housing, and ??? What name will be given to the US Peak Equity and Gold in USD May 2024 global asset valuation collapse?
Monday, February 12, 2024
SPX Maximum Self-Assembly Lammert Fractal Growth: X/2.5X/2.5X :: 35/86/88 Weeks - March 2020 to 12/13 February 2024
March 2020 Peak Lammert Fractal Growth and the Great 1982 13/31-32 Year Crash
From March 2020 the fractal math for the maximum time based self-assembly fractal growth for equities is quite simple : X/2.5X/2.5X , where X is the time length of the First Fractal Base ending in a low valuation (30 October 2020), 2.5X is the time length of the Second Fractal ending in a low valuation (16/17 June 2022), and 2.5X is the time length of the Third Fractal ending in a peak valuation. (12/13 February 2024)
First Fractal: X: 35 weeks: 23 March 2020 to 30 October 2020
(3)/33 weeks {the first 3 weeks (3) represent preceding terminal decay}
X is the time length of the First Fractal with all intervening daily/weekly valuations above the valuations of the first and last time unit (day or week) of the First Fractal Base grouping. Because growth begins in decay, the First Fractal Base X includes 3 weeks of a preceding decay series. This 3 week grouping serves as base subfractal for (3)/6/7/5 week subfractal growth series within the First Fractal Base. (see above figure)
Second Fractal: 2.5X: 86 weeks 30 October 2020 to 16/17 June 2022
The Second Fractal is the most characteristic Fractal unit and is defined by an observable nonlinear gap lower low valuation between 2X and 2.5X. See the 2005 opening page of The Economic Fractalist website. This occurs between week 85 and 86. (see above figure)
Third Fractal: 2.5X: 88 Weeks 16/17 June 2022 to 12/13 February 2024
The Third 88 week 2.5X Fractal was completed on 12/13 February 2024 and was concluded with a daily Lammert fractal growth series starting 27 October 2023. (below image)
The concluding 27 October 2023 self assembly growth fractal series is composed of a 16/33/26 day fractal series. In this case the Second Fractal of 33 days days determines the ideal length of the first base fractal as 13 days (33 divided by 2.5) The Third Fractal of 2X or 2 times 13 is 26 days occurring on 12 February 2024. The SPX made a new high on 12 February 2024 and ended near the low of the trading day.
A hard landing is coming for the global economy with an expected global equity low valuation in January/February 2025.
Sunday, January 21, 2024
The Great 1982 13/31 of 31-32 Year Second Fractal 2024-25 US Wilshire Crash
As part of a 1807 US hegemony x/2.5x/2.5x/1.5x :: 36/90/90/54 year great fractal progression with nadirs in 1842/43 and 1932, and a peak valuation in November 2021, the valuation of the US progenitor and composite Wilshire has risen with post World War II US global money/credit expansion and with initially its enormous geopolitical and manufacturing dominance. Since the Volcker US peak interest rates in 1982, the Wilshire has been propelled by money and debt expansion from both the gradual 45 year lowering of US (and global) interest rates and later from direct central bank creation and ownership of debt and 2020 MBS’s and from historically low corporate and private debt interest rates tied to near zero fed funds rates whose combined QE effect fueled the post Covid equity boom.
While the US 3 month Treasury minus Ten Year Note has been inverted to a depth and monthly duration similar to the pre1929 equity crash, the SPX, ( but not the Wilshire which includes small cap equities), has peaked on 19 January 2024 to a new high. It is both the combination of end phase creation of service-based economy jobs associated with new debt creation and money dis-proportionally pouring into the SPX’s big 7 tech companies which have supported the SPX’s recent bubble peak valuation.
The 1807 36 year Wilshire progenitor First Fractal ended in 1842/43. The 90 year Second Fractal peaked in 1929 and nadir-ed in 1932. The 90 year 8 July 1932 Wilshire composite Third Fractal peaked on 8 November 2021 with a 54 year 4th Fractal expected to end in 2074.
The US 90 year Third Fractal and 54 year Third Fractal are composed of two interpolated sub-series: a 51 year fractal sub-series 1932 to 1982 of 10-11/22/21 years and a 1982 13/31-32/31-32/18-20 year fractal series ending in 2074.
The graphs below show the quarterly fractal progression from 1982 of 49/120 of 123-5 quarters.
The monthly progression from March 2020 is 8-9/21/20 of 20-21/12-13 months :: x/2.5x/2.5x/1.5-1.6x
Subscribe to:
Posts (Atom)