
Tuesday, May 13, 2025
THE 3 FEBRUARY 2025 SPX PRIMARY CRASH FRACTAL SEQUENCE
The incipient crash fractal sequence of the 1982 13/32 of 33 year 1st and 2nd fractal series which includes the terminal 27 October 2023 55/139/136 day :: x/2.5x/2.5x 19 February 2025 SPX peak valuation is a 3 February 14/32/26-32/20 day :: x/2-2.5x/2x’-2.5x’/1.5x’ 4-phase Lammert Fractal Series.

Sunday, May 11, 2025
The Case for a Mathematical Asset-Debt Macroeconomic System: 27 October 2023 to 17 June 2025: A 55/139/136/83 day :: x/2.5x/2.5x/1.5x 4-phase Lammert Fractal Series
The Case for a Self-Assembly Mathematical Asset-Debt System
The purpose of this website for the last 20 years has been to demonstrate that the asset-debt macroeconomic system is self-ordered by deterministic elegantly simple mathematical laws of time-based fractal growth and decay of its easily tradable assets. This fractal self assembly process is included as a primer at the end of the post.
The 1807 US hegemony commodity and equity valuations are self-ordered in a series of mostly nadirs and a 3rd fractal peak in a 4-phase x/2.5x/2.5x/1.5x :: 36/90/90/54 year fractal series with lows in 1807/1842-43/1932, a projected low in 2074, and a 90 year 3rd Fractal peak in November 2021. The 2020 US government 3.13 trillion dollar deficit spending that combated Covid represented 14.7 % deficit to GDP spending which was followed by a 2.78 trillion deficit spending or a 11.7% deficit to GDP spending in 2021. This historically high peacetime deficit spending (by comparison 1942 was 12.2%) resulted in a 90 year US 3rd fractal composite equity high in Nov 2021 and a subsequent higher high on 19 Feb 2025..
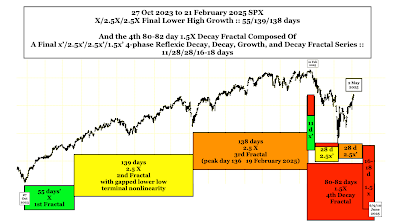
After an interim low on 27 October 2023, the SPX has followed a 3-phase maximum growth series of 55/139/136 days :: x/2.5x/2.5x with a peak valuation on 19 February 2025 and a secondary lower high peak on
day 138 or 2.5x on 21 February 2025.
If the SPX follows a similar fractal pattern as the US 1807 4-phase x/2.5x/2.5x/1.5x fractal pattern ending in 2074, the 27 Oct 2023 SPX pattern will end with a interim low on 17 June 2025 or 55/139/136/83 days :: x/2.5x/2.5x/1.5x.
 This is an interim low of a interpolated 1982 13/32 of 33 year 1st and 2nd fractal series ending in 2026.
 The 139 day 2nd fractal in yellow below shows the characteristic 2nd nonlinear gapped lower lows between days 137 and 138 and between days 138 and 139 of its terminal portion just as described 20 years ago in the main page of the Economic Fractalist.
 The 3rd (orange) and 4th(red) fractals are shown in more detail below. After a 3-phase 5 August 2024 18+/48/47 day :: x/2.5x/2.5x growth fractal series, the final blow-off for the SPX occurred in two sequential smaller 3-phase series: a 3/8/6 day :: x/2.5x/2x fractal growth series and a final 3/6/5 day :: x/2x/1.6x series ending with a peak valuation on 19 February 2025.
 The 4th fractal is shown below is a composite of 4 sequential fractal series: One: a 19 February 5/13/11/7 day 4-phase decay fractal series with an 11 day interim counter trend growth 3rd fractal and a 7 day 4th decay fractal with gapped lower low nonlinearity between days 4 and 5 and 5 and 6 ending with a nadir on day 7 and 7 April. Two and Three are counter-trend growth series of 2/4/4/3 days and 3/6/8 days ending on 9 May 2025. Four is expected to be similar to the 19 February 2025 4 phase series: a 9 May 4/10/10/6 days series with counter trend growth on the 3rd 10 day fractal and a crash 6 day 4th fractal ending 17 June 2024. See below.
 Two interpolated three phase y/2-2.5y/2-2.5y fractal decay series are shown below:
 A Primer on Quantitative Time-based Fractal Growth and Decay of The Asset-Debt Macroeconomic System’s Composite Equities
Qualitatively …on the longest time-unit cycles (years) (e.g. 1807 36/90/90/54-57 years and 1982 13/32 of 33/32/-33/20 years) credit expands via governmental, corporate, and citizen debt; assets are produced and over-produced , overvalued and over-consumed; consumers reach maximum debt loads; the population of possible traders/invested are fully invested and composite equity asset valuations reach a singular fractal time-unit (minute, hour, day, week, month) peak valuation and thereafter undergo decay; recessions occur with weakening demand, interest rates fall; excess debt undergoes default and restructuring; individual and corporate bankruptcies occur; and composite equity (and commodity) asset valuations eventually reach a singular fractal time-unit nadir. The cycle thereafter repeats itself.
On smaller time-unit fractal cycles (quarters, months, weeks, days, hours, 15-minute/ 5 and 1-minute) : trader/investor population saturation of asset buying occurs ending in a transient peak valuation .. followed by trader/investor population saturation end selling resulting in a transient nadir valuation. These peaks and nadirs occur in one of the two quantitative fractal patterns as above.
Empirically composite equity asset valuation growth and decay cycles occur in 2 modes(laws) of mathematical self-organizing, self-assembly time-based fractal series:
a 4-phase fractal series: x/2-2.5x/2-2.5x/1.5-1.6x and
a 3-phase fractal series: x/2-2.5x/1.5-2.5x
In the 4-phase fractal series sequential elements are termed: the 1st, 2nd, 3rd, and 4th fractals and in the 3-phase fractal series: the 1st, 2nd, and 3rd fractals.
The 2nd fractal is characterized by terminal gapped nonlinear lower lows between the 2nd fractal’s terminal 2x and 2.5x time period. (These gapped nonlinear lower lows can be observed in weekly valuation units for the DJIA between 1929 and 1932, the terminal portion of the US 90 year 2nd fractal; within the last three day before the terminal 5 August 2024 139 day 2nd fractal low occurring in the 27 October 2023 55/139/136 day :: x/2.5x/2.5x valuation maximum growth series ending 19 February 2025: and can be expected within last 14-15 months on a daily and weekly basis of the current 32 of 33 year 2nd fractal of the interpolated 1982 13/32 of 33 year 1st and 2nd fractal series.
With the exception of the 3rd fractal in the 4-phase series whose fractal grouping is determined by its terminal high or final lower high peak valuation, fractals (fractal groupings) are determined by the nadirs of the first and last time unit in the grouping with all intervening valuations above the connecting nadir trend-line.
A Primer on Quantitative Time-based Fractal Growth and Decay of The Asset-Debt Macroeconomic System’s Composite Equities
Qualitatively …on the longest time-unit cycles (years) (e.g. 1807 36/90/90/54-57 years and 1982 13/32 of 33/32/-33/20 years) credit expands via governmental, corporate, and citizen debt; assets are produced and over-produced , overvalued and over-consumed; consumers reach maximum debt loads; the population of possible traders/invested are fully invested and composite equity asset valuations reach a singular fractal time-unit (minute, hour, day, week, month) peak valuation and thereafter undergo decay; recessions occur with weakening demand, interest rates fall; excess debt undergoes default and restructuring; individual and corporate bankruptcies occur; and composite equity (and commodity) asset valuations eventually reach a singular fractal time-unit nadir. The cycle thereafter repeats itself.
On smaller time-unit fractal cycles (quarters, months, weeks, days, hours, 15-minute/ 5 and 1-minute) : trader/investor population saturation of asset buying occurs ending in a transient peak valuation .. followed by trader/investor population saturation end selling resulting in a transient nadir valuation. These peaks and nadirs occur in one of the two quantitative fractal patterns as above.
Empirically composite equity asset valuation growth and decay cycles occur in 2 modes(laws) of mathematical self-organizing, self-assembly time-based fractal series:
a 4-phase fractal series: x/2-2.5x/2-2.5x/1.5-1.6x and
a 3-phase fractal series: x/2-2.5x/1.5-2.5x
In the 4-phase fractal series sequential elements are termed: the 1st, 2nd, 3rd, and 4th fractals and in the 3-phase fractal series: the 1st, 2nd, and 3rd fractals.
The 2nd fractal is characterized by terminal gapped nonlinear lower lows between the 2nd fractal’s terminal 2x and 2.5x time period. (These gapped nonlinear lower lows can be observed in weekly valuation units for the DJIA between 1929 and 1932, the terminal portion of the US 90 year 2nd fractal; within the last three day before the terminal 5 August 2024 139 day 2nd fractal low occurring in the 27 October 2023 55/139/136 day :: x/2.5x/2.5x valuation maximum growth series ending 19 February 2025: and can be expected within last 14-15 months on a daily and weekly basis of the current 32 of 33 year 2nd fractal of the interpolated 1982 13/32 of 33 year 1st and 2nd fractal series.
With the exception of the 3rd fractal in the 4-phase series whose fractal grouping is determined by its terminal high or final lower high peak valuation, fractals (fractal groupings) are determined by the nadirs of the first and last time unit in the grouping with all intervening valuations above the connecting nadir trend-line.


Monday, May 5, 2025
AN ELEGANTLY SIMPLE 3 FEBRUARY 2025 FRACTAL REPLAY OF 1929?
The primary fractal decay series in August 1929 was a 12/29/27 day :: 3-phase x/2-2.5x/2-2.5x fractal series with a 3 Sept 1929 peak valuation on the 6th day of the 29 day 2nd fractal.
(Below the 1929 12/29/27 day :: x/2-2.5x/2-2.5x 3-phase Lammert decay series) It is possible that a similar x/2-2.5x/2-2.5x decay series started on 3 February 2025 with the peak SPX valuation on 19 February 2025, day 12 of the 14 day 1st Fractal. The analogous 1929 3-phase fractal decay series is 14/32/31-33 days :: x/2-2.5x/2-2.5x.
 The global macroeconomy is near the end of a 1982 13/33 year :: x/2.5x asset-debt credit (fractal) cycle ending in 2026. This is analogous to the 1807 36/90 year :: x/2.5x Asset Debt 1st and 2nd fractal cycle with a DJIA peak on 3 September 1929 and final nadir on 8 July 1932. On a long term scale the 1842-43 90 year 1929 to 1932 peak to nadir DJIA 90% devaluation has the characteristics of a 2nd fractal nonlinear collapse.
The current 1982 13/33 year :: x/2.5x cycle with 32 of 33 years of its 2nd fractal completed and its ongoing 2nd fractal nonlinear collapse is interpolated within the larger US hegemonic 1807 36/90/90/54-57 year :: x/2.5x/2.5x/1.5-1.6x 4-phase fractal series ending in 2074 – 2077 with the 1932 90 year 3rd fractal peaking on 8 November 2021. (see primer below)
The global macroeconomy is near the end of a 1982 13/33 year :: x/2.5x asset-debt credit (fractal) cycle ending in 2026. This is analogous to the 1807 36/90 year :: x/2.5x Asset Debt 1st and 2nd fractal cycle with a DJIA peak on 3 September 1929 and final nadir on 8 July 1932. On a long term scale the 1842-43 90 year 1929 to 1932 peak to nadir DJIA 90% devaluation has the characteristics of a 2nd fractal nonlinear collapse.
The current 1982 13/33 year :: x/2.5x cycle with 32 of 33 years of its 2nd fractal completed and its ongoing 2nd fractal nonlinear collapse is interpolated within the larger US hegemonic 1807 36/90/90/54-57 year :: x/2.5x/2.5x/1.5-1.6x 4-phase fractal series ending in 2074 – 2077 with the 1932 90 year 3rd fractal peaking on 8 November 2021. (see primer below)
 After the 2026 nadir, the follwing 33 years will be characterized by further US financialization of debt, new money, and new credit creation and development of new financial instruments such as 50 year loans. While the current administration’s policies will promote a departure from the dollar to other possible exchange items, America’s prior defense spending, role as a nuclear superpower, and AI and robotics capabilities, will likely carry the fraying US hegemony for another two or three decades.
The peak for the SPX of the 1982 13/33 year cycle occurred on 19 Feb 2025 with the final lower high on 21 February or day 138 of a 27 October 2023 55/139/138 day :: x/2.5x/2.5x maximum 3-phase growth series.
After the 2026 nadir, the follwing 33 years will be characterized by further US financialization of debt, new money, and new credit creation and development of new financial instruments such as 50 year loans. While the current administration’s policies will promote a departure from the dollar to other possible exchange items, America’s prior defense spending, role as a nuclear superpower, and AI and robotics capabilities, will likely carry the fraying US hegemony for another two or three decades.
The peak for the SPX of the 1982 13/33 year cycle occurred on 19 Feb 2025 with the final lower high on 21 February or day 138 of a 27 October 2023 55/139/138 day :: x/2.5x/2.5x maximum 3-phase growth series.
 A Primer on Quantitative Time-based Fractal Growth and Decay of The Asset-Debt Macroeconomic System’s Composite Equities
Qualitatively …on the longest time-unit cycles (years) (e.g. 1807 36/90/90/54-57 years and 1982 13/32 of 33/32/-33/20 years) credit expands via governmental, corporate, and citizen debt; assets are produced and over-produced , overvalued and over-consumed; consumers reach maximum debt loads; the population of possible traders/invested are fully invested and composite equity asset valuations reach a singular fractal time-unit (minute, hour, day, week, month) peak valuation and thereafter undergo decay; recessions occur with weakening demand, interest rates fall; excess debt undergoes default and restructuring; individual and corporate bankruptcies occur; and composite equity (and commodity) asset valuations eventually reach a singular fractal time-unit nadir. The cycle thereafter repeats itself.
On smaller time-unit fractal cycles (quarters, months, weeks, days, hours, 15-minute/ 5 and 1-minute) : trader/investor population saturation of asset buying occurs ending in a transient peak valuation .. followed by trader/investor population saturation end selling resulting in a transient nadir valuation. These peaks and nadirs occur in one of the two quantitative fractal patterns as above.
Empirically composite equity asset valuation growth and decay cycles occur in 2 modes(laws) of mathematical self-organizing, self-assembly time-based fractal series:
a 4-phase fractal series: x/2-2.5x/2-2.5x/1.5-1.6x and
a 3-phase fractal series: x/2-2.5x/1.5-2.5x
In the 4-phase fractal series sequential elements are termed: the 1st, 2nd, 3rd, and 4th fractals and in the 3-phase fractal series: the 1st, 2nd, and 3rd fractals.
The 2nd fractal is characterized by terminal gapped nonlinear lower lows between the 2nd fractal’s terminal 2x and 2.5x time period. (These gapped nonlinear lower lows can be observed in weekly valuation units for the DJIA between 1929 and 1932, the terminal portion of the US 90 year 2nd fractal; within the last three day before the terminal 5 August 2024 139 day 2nd fractal low occurring in the 27 October 2023 55/139/136 day :: x/2.5x/2.5x valuation maximum growth series ending 19 February 2025: and can be expected within last 14-15 months on a daily and weekly basis of the current 32 of 33 year 2nd fractal of the interpolated 1982 13/32 of 33 year 1st and 2nd fractal series.
With the exception of the 3rd fractal in the 4-phase series whose fractal grouping is determined by its terminal high or final lower high peak valuation, fractals (fractal groupings) are determined by the nadirs of the first and last time unit in the grouping with all intervening valuations above the connecting nadir trend-line.
A Primer on Quantitative Time-based Fractal Growth and Decay of The Asset-Debt Macroeconomic System’s Composite Equities
Qualitatively …on the longest time-unit cycles (years) (e.g. 1807 36/90/90/54-57 years and 1982 13/32 of 33/32/-33/20 years) credit expands via governmental, corporate, and citizen debt; assets are produced and over-produced , overvalued and over-consumed; consumers reach maximum debt loads; the population of possible traders/invested are fully invested and composite equity asset valuations reach a singular fractal time-unit (minute, hour, day, week, month) peak valuation and thereafter undergo decay; recessions occur with weakening demand, interest rates fall; excess debt undergoes default and restructuring; individual and corporate bankruptcies occur; and composite equity (and commodity) asset valuations eventually reach a singular fractal time-unit nadir. The cycle thereafter repeats itself.
On smaller time-unit fractal cycles (quarters, months, weeks, days, hours, 15-minute/ 5 and 1-minute) : trader/investor population saturation of asset buying occurs ending in a transient peak valuation .. followed by trader/investor population saturation end selling resulting in a transient nadir valuation. These peaks and nadirs occur in one of the two quantitative fractal patterns as above.
Empirically composite equity asset valuation growth and decay cycles occur in 2 modes(laws) of mathematical self-organizing, self-assembly time-based fractal series:
a 4-phase fractal series: x/2-2.5x/2-2.5x/1.5-1.6x and
a 3-phase fractal series: x/2-2.5x/1.5-2.5x
In the 4-phase fractal series sequential elements are termed: the 1st, 2nd, 3rd, and 4th fractals and in the 3-phase fractal series: the 1st, 2nd, and 3rd fractals.
The 2nd fractal is characterized by terminal gapped nonlinear lower lows between the 2nd fractal’s terminal 2x and 2.5x time period. (These gapped nonlinear lower lows can be observed in weekly valuation units for the DJIA between 1929 and 1932, the terminal portion of the US 90 year 2nd fractal; within the last three day before the terminal 5 August 2024 139 day 2nd fractal low occurring in the 27 October 2023 55/139/136 day :: x/2.5x/2.5x valuation maximum growth series ending 19 February 2025: and can be expected within last 14-15 months on a daily and weekly basis of the current 32 of 33 year 2nd fractal of the interpolated 1982 13/32 of 33 year 1st and 2nd fractal series.
With the exception of the 3rd fractal in the 4-phase series whose fractal grouping is determined by its terminal high or final lower high peak valuation, fractals (fractal groupings) are determined by the nadirs of the first and last time unit in the grouping with all intervening valuations above the connecting nadir trend-line.


Saturday, May 3, 2025
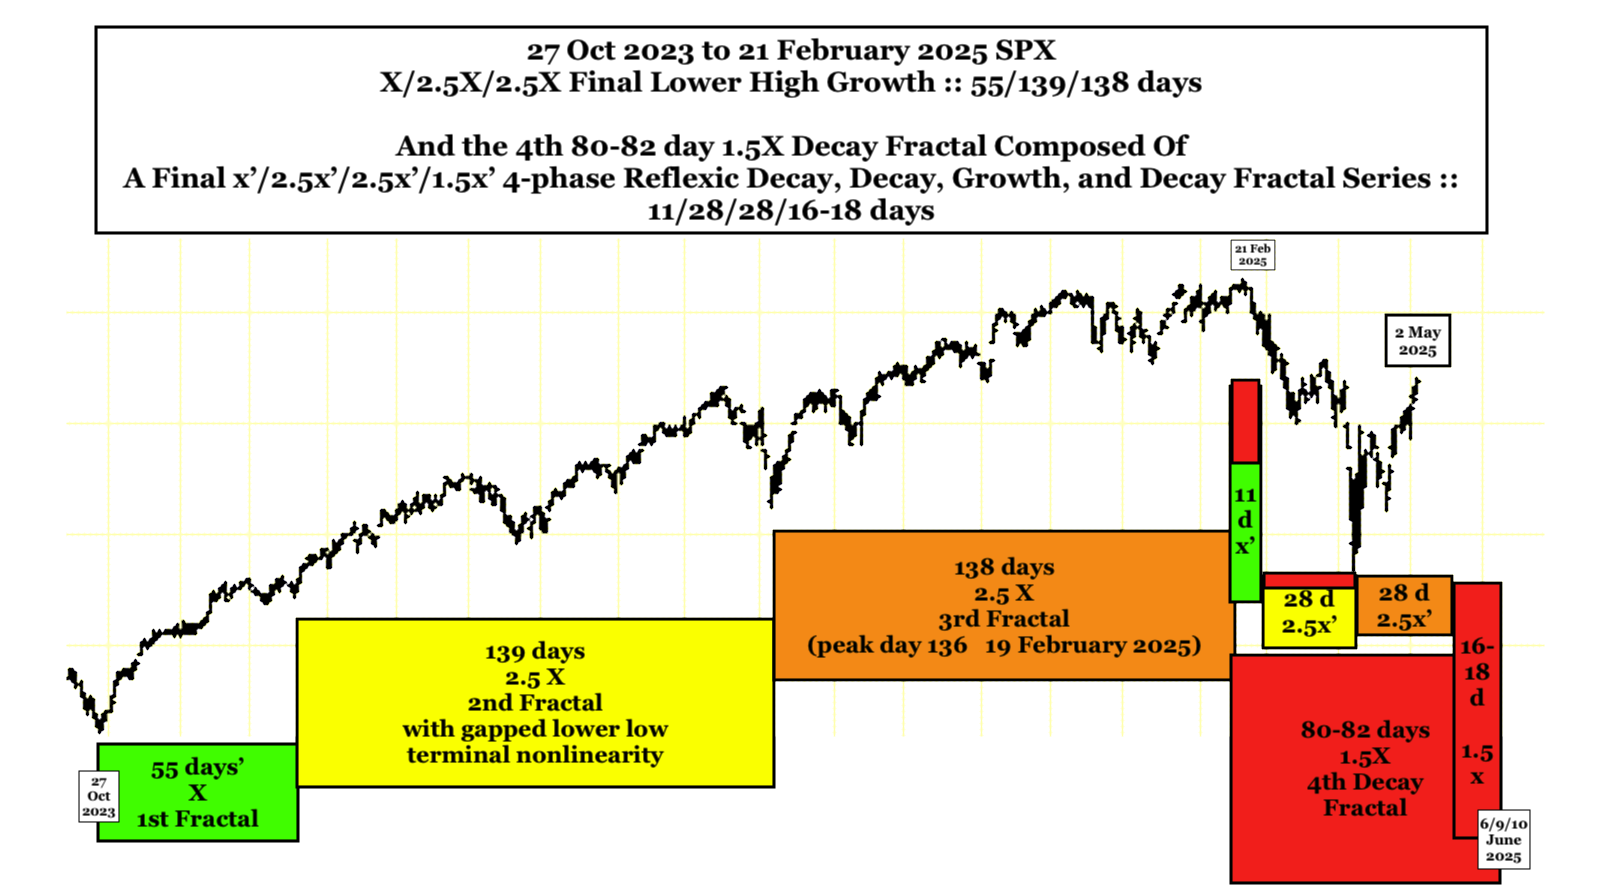
The SPX 27 October 2023 to 19 Feb 2025 Final Peak Valuation Growth: x/2.5x/2.5x :: 55/139/136 days; The Interpolated 12 Feb 2025 11/28/28/16-18 day :: x/2.5x/2.5x/1.5-1.6x 4-Phase Decay/Decay/Reflexic Growth/ Crash Decay Fractal Series Ending 6-10 June 2025
The global macroeconomy is near the end of a 1982 13/33 year :: x/2.5x asset-debt credit (fractal) cycle ending in 2026. This is analogous to the 1807 36/90 year :: x/2.5x Asset Debt 1st and 2nd fractal cycle with a DJIA peak on 3 September 1929 and final nadir on 8 July 1932. On a long term scale the 1842-43 90 year 1929 to 1932 peak to nadir DJIA 90% devaluation has the characteristics of a 2nd fractal nonlinear collapse.
The current 1982 13/33 year :: x/2.5x cycle with 32 of 33 years of its 2nd fractal completed and its ongoing 2nd fractal nonlinear collapse is interpolated within the larger US hegemonic 1807 36/90/90/54-57 year :: x/2.5x/2.5x/1.5-1.6x 4-phase fractal series ending in 2074 - 2077 with the 1932 90 year 3rd fractal peaking on 8 November 2021. (see primer below)
After the 2026 nadir, the follwing 33 years will be characterized by further US financialization of debt, new money, and new credit creation and development of new financial instruments such as 50 year loans. While the current administration's policies will promote a departure from the dollar to other possible exchange items, America's prior defense spending, role as a nuclear superpower, and AI and robotics capabilities, will likely carry the fraying US hegemony for another two or three decades.
The peak for the SPX of the 1982 13/33 year cycle occurred on 19 Feb 2025 with the final lower high on 21 February or day 138 of a 27 October 2023 55/139/138 day :: x/2.5x/2.5x maximum 3-phase growth series.
A logical conclusion to this series would be a 1.5x 4th decay fractal of 82-83 days or 1.5 times the 27 Oct 2023 1st fractal base of 55 days.
 The final fractal series from 12 Feb 2025 is a 11/28/28/16-18 day :: x/2.5x/2.5x/1.5-1.6x 4 phase fractal series. The 1st and 2nd series are deteriorating decay fractals(as denoted by the red horizontal bars), the 28 3rd fractal is a countertrend growth fractal peaking on day 28 and the 4th 1.5-1.6x fractal of 16-18 days is a decay fractal with the crash devaluation in the terminal final days. This would put the nadir of the 11/28/28/16-18 day series on 6,9, or 10 June 2025.
 The final 16-18 day 4th decay fractal may start as the concluding part of the 3rd fractal blow-off, both represented by a 3-phase 5/3 of 10-11/10-11 day :: x/2-2.5x/2-2.5x fractal series with the first 7 days representing the terminal portion of the 28 day 3rd fractal and the last 16-18 days of the fractal series representing the 4th decay fractal. This 3-phase series could also be configured 5/12-13/7-8 days :: x/2-2.5x/1.5-1.6x. With money being repatriated from the US equity markets and with new deficit spending for NATO military hardware and expansion, it is possible that the German DAX will blow-off to valuations near to or exceeding its prior high.
The total SPX 80-82 day fractal series is about 17 weeks in length with an expected final low(equivalent to 8 July 1932) in about 17/34/34/ 20-25 weeks :: x/2x/2x/1.5x'.
Below is a primer on deterministic self-assembly asset-debt time based quantitative fractal macroeconomics copied from a previous posting.
A Primer on Quantitative Time-based Fractal Growth and Decay of The Asset-Debt Macroeconomic System’s Composite Equities
Qualitatively …on the longest time-unit cycles (years) (e.g. 1807 36/90/90/54-57 years and 1982 13/32 of 33/32/-33/20 years) credit expands via governmental, corporate, and citizen debt; assets are produced and over-produced , overvalued and over-consumed; consumers reach maximum debt loads; the population of possible traders/invested are fully invested and composite equity asset valuations reach a singular fractal time-unit (minute, hour, day, week, month) peak valuation and thereafter undergo decay; recessions occur with weakening demand, interest rates fall; excess debt undergoes default and restructuring; individual and corporate bankruptcies occur; and composite equity (and commodity) asset valuations eventually reach a singular fractal time-unit nadir. The cycle thereafter repeats itself.
On smaller time-unit fractal cycles (quarters, months, weeks, days, hours, 15-minute/ 5 and 1-minute) : trader/investor population saturation of asset buying occurs ending in a transient peak valuation .. followed by trader/investor population saturation end selling resulting in a transient nadir valuation. These peaks and nadirs occur in one of the two quantitative fractal patterns as above.
Empirically composite equity asset valuation growth and decay cycles occur in 2 modes(laws) of mathematical self-organizing, self-assembly time-based fractal series:
a 4-phase fractal series: x/2-2.5x/2-2.5x/1.5-1.6x and
a 3-phase fractal series: x/2-2.5x/1.5-2.5x
In the 4-phase fractal series sequential elements are termed: the 1st, 2nd, 3rd, and 4th fractals and in the 3-phase fractal series: the 1st, 2nd, and 3rd fractals.
The 2nd fractal is characterized by terminal gapped nonlinear lower lows between the 2nd fractal’s terminal 2x and 2.5x time period. (These gapped nonlinear lower lows can be observed in weekly valuation units for the DJIA between 1929 and 1932, the terminal portion of the US 90 year 2nd fractal; within the last three day before the terminal 5 August 2024 139 day 2nd fractal low occurring in the 27 October 2023 55/139/136 day :: x/2.5x/2.5x valuation maximum growth series ending 19 February 2025: and can be expected within last 14-15 months on a daily and weekly basis of the current 32 of 33 year 2nd fractal of the interpolated 1982 13/32 of 33 year 1st and 2nd fractal series.
With the exception of the 3rd fractal in the 4-phase series whose fractal grouping is determined by its terminal high or final lower high peak valuation, fractals (fractal groupings) are determined by the nadirs of the first and last time unit in the grouping with all intervening valuationsWhy does the asset-debt macroeconomic system self-organize to the maximum length x/2.5x/2.5x fractal time-based growth length? It is because equities represent the system’s best available investment with the highest return with superiority over other held assets in terms of possible dividends, valuation growth, tradability, tax-advantaged capital gains, corporate advantaged debt acquisition, and corporate advantaged buy-back legislation above the connecting nadir trend-line.
The final 16-18 day 4th decay fractal may start as the concluding part of the 3rd fractal blow-off, both represented by a 3-phase 5/3 of 10-11/10-11 day :: x/2-2.5x/2-2.5x fractal series with the first 7 days representing the terminal portion of the 28 day 3rd fractal and the last 16-18 days of the fractal series representing the 4th decay fractal. This 3-phase series could also be configured 5/12-13/7-8 days :: x/2-2.5x/1.5-1.6x. With money being repatriated from the US equity markets and with new deficit spending for NATO military hardware and expansion, it is possible that the German DAX will blow-off to valuations near to or exceeding its prior high.
The total SPX 80-82 day fractal series is about 17 weeks in length with an expected final low(equivalent to 8 July 1932) in about 17/34/34/ 20-25 weeks :: x/2x/2x/1.5x'.
Below is a primer on deterministic self-assembly asset-debt time based quantitative fractal macroeconomics copied from a previous posting.
A Primer on Quantitative Time-based Fractal Growth and Decay of The Asset-Debt Macroeconomic System’s Composite Equities
Qualitatively …on the longest time-unit cycles (years) (e.g. 1807 36/90/90/54-57 years and 1982 13/32 of 33/32/-33/20 years) credit expands via governmental, corporate, and citizen debt; assets are produced and over-produced , overvalued and over-consumed; consumers reach maximum debt loads; the population of possible traders/invested are fully invested and composite equity asset valuations reach a singular fractal time-unit (minute, hour, day, week, month) peak valuation and thereafter undergo decay; recessions occur with weakening demand, interest rates fall; excess debt undergoes default and restructuring; individual and corporate bankruptcies occur; and composite equity (and commodity) asset valuations eventually reach a singular fractal time-unit nadir. The cycle thereafter repeats itself.
On smaller time-unit fractal cycles (quarters, months, weeks, days, hours, 15-minute/ 5 and 1-minute) : trader/investor population saturation of asset buying occurs ending in a transient peak valuation .. followed by trader/investor population saturation end selling resulting in a transient nadir valuation. These peaks and nadirs occur in one of the two quantitative fractal patterns as above.
Empirically composite equity asset valuation growth and decay cycles occur in 2 modes(laws) of mathematical self-organizing, self-assembly time-based fractal series:
a 4-phase fractal series: x/2-2.5x/2-2.5x/1.5-1.6x and
a 3-phase fractal series: x/2-2.5x/1.5-2.5x
In the 4-phase fractal series sequential elements are termed: the 1st, 2nd, 3rd, and 4th fractals and in the 3-phase fractal series: the 1st, 2nd, and 3rd fractals.
The 2nd fractal is characterized by terminal gapped nonlinear lower lows between the 2nd fractal’s terminal 2x and 2.5x time period. (These gapped nonlinear lower lows can be observed in weekly valuation units for the DJIA between 1929 and 1932, the terminal portion of the US 90 year 2nd fractal; within the last three day before the terminal 5 August 2024 139 day 2nd fractal low occurring in the 27 October 2023 55/139/136 day :: x/2.5x/2.5x valuation maximum growth series ending 19 February 2025: and can be expected within last 14-15 months on a daily and weekly basis of the current 32 of 33 year 2nd fractal of the interpolated 1982 13/32 of 33 year 1st and 2nd fractal series.
With the exception of the 3rd fractal in the 4-phase series whose fractal grouping is determined by its terminal high or final lower high peak valuation, fractals (fractal groupings) are determined by the nadirs of the first and last time unit in the grouping with all intervening valuationsWhy does the asset-debt macroeconomic system self-organize to the maximum length x/2.5x/2.5x fractal time-based growth length? It is because equities represent the system’s best available investment with the highest return with superiority over other held assets in terms of possible dividends, valuation growth, tradability, tax-advantaged capital gains, corporate advantaged debt acquisition, and corporate advantaged buy-back legislation above the connecting nadir trend-line.

Thursday, May 1, 2025
Mayday ... Yet Another 3-Phase Lammert Primary Fractal Crash Decay Series Model ... 3 Feb 2025 to 12 June 2025

Subscribe to:
Comments (Atom)