
Sunday, November 19, 2023
NEW TARGET FOR GLOBAL CRASH LOW: 8 DECEMBER 2023
US long term debt instruments reached an inter-day low of 0.4 pc on 9 March 2020 and have risen to a high of 4.997 pc on 23 October 2023. The US central bank is simply allowing supply and demand market forces to apply QT to an overheated economy fueled by printed money, 2 plus trillion dollars of covid savings, and covid forbearance of payments on US MBS related mortgages and US-lended college debt. Covid savings and easy forbearances on debt payments are expiring or have expired. Outstanding credit card debt, subprime automobile debt, and student loan debt make it difficult for further private debt expansion for the masses in the US consumer based economy.
The current fractal pattern of the US Ten Year Note interest rates, in conjunction with the monthly, weekly, and daily fractal patterns of global equity, gold, commodity, and cryptocurrencies provide predictive guidance for the 2023 interim crash low for the non-debt asset entities.
After completing a March 2020, 7/16/17 month :: x/2-2.5x/2-2.5x fractal growth series, US Ten Year interest rates have self ordered into an observable 2/4/4 month fractal growth pattern. On a weekly basis this 2/4/4 month growth fractal is composed of two fractal series: 5/12/7 weeks :: x/2.5x/1.5x and 3/8/3 of 6 weeks :: x/2.5x/2x. The daily fractal series from 5 April 2023 is 21/52/32 days correlating to the 5/12/7 week fractal series and 14/32/ 11 of 25 to 26 days correlating to the 3/8/3 of 6 week fractal growth series. The daily fractal series for US Ten Year Note interest rates are depicted in the image below.
 The beginning nadir month of a monthly fractal series contains 4 weeks in it and the beginning nadir week of a weekly fractal series contains 5 days which must be added to the daily subfractal (1) series. For the SPX , 5 down days in the first weekly is added to the 52 day 13 March 2023 to 24 May 2023 subfractal (1) for a total of 56 days {56 vice 57 days because the fifth day of the 5 days contained in the first week down is same as the first day of the subsequent 52 day subfractal(1) series). 8 December 2023 would complete a 56/139 day :: x/2-2.5x subfractal(1) and subfractal (2)series. If the final lower high for the US Ten year note was on day 26 of a 14/32/26 day series 11 December 2023, would complete a 56/140 day series.
Bitcoin in USD final daily series(trading 7 days a week) appears to be self-assembled into an 11 October 2023 10/25/25 day fractal series ending on 8 December 2023. Ford is appears to be self-ordered as a 24 May 2023 19/47/47/14 of 28 to 29 day :: x/2.5x/2.5x/1.5x fractal series ending 8 December or 11 December 2023.
The beginning nadir month of a monthly fractal series contains 4 weeks in it and the beginning nadir week of a weekly fractal series contains 5 days which must be added to the daily subfractal (1) series. For the SPX , 5 down days in the first weekly is added to the 52 day 13 March 2023 to 24 May 2023 subfractal (1) for a total of 56 days {56 vice 57 days because the fifth day of the 5 days contained in the first week down is same as the first day of the subsequent 52 day subfractal(1) series). 8 December 2023 would complete a 56/139 day :: x/2-2.5x subfractal(1) and subfractal (2)series. If the final lower high for the US Ten year note was on day 26 of a 14/32/26 day series 11 December 2023, would complete a 56/140 day series.
Bitcoin in USD final daily series(trading 7 days a week) appears to be self-assembled into an 11 October 2023 10/25/25 day fractal series ending on 8 December 2023. Ford is appears to be self-ordered as a 24 May 2023 19/47/47/14 of 28 to 29 day :: x/2.5x/2.5x/1.5x fractal series ending 8 December or 11 December 2023.
Wednesday, November 15, 2023
New Target Date for November 2023 crash low: 29 November 2023 day 130 of a 13 March 2023 52/130 day :: x/2.5x fractal series
The 14 day valuation gain from the 27 October 2023 low was unexpected but within the 13 March 2023 52 /104 to 130 day :: x/2x-2.5x nonlinear window. Qualitatively, the dominant service sector US economy has an operational consumer population that has no savings and has the highest ever collective debt at the highest interest rates in over 15 years. The consumer is tapped out. The Chinese economy whose base population savings is in real estate has a different, but real problem with the collapse of property and real estate prices and a collapse of stock valuations of the large corporations, e.g., Evergrande and Country Garden who build residential properties and are currently defaulting on interest debt payments. With collapsing Chinese property values (and equivalent savings), decreased foreign consumption demand because of foreign consumer debt load, and decreased domestic demand because of lost savings, the Chinese economy is near the threshold of significant retrenchment. The Bank of Shanghai, a proxy for the Chinese macroeconomic system, appears to be following a July 2021 35/85 of 87/70 week :: x/2.5x/2x fractal decay series with a subfractal (2) 87 week expected low at the end of November 2023.
The 13 March 2023 to 29 November 2023 52/121 of 130 day :: x/2.5sx fractal series is depicted below with the current 14 day gain part of a 26 September 2023 7/18/14/1 of 10 day fractal decay series.


Sunday, November 12, 2023
Lammert Saturation Asset-Debt Macroeconomics: The Current November 2023 Crash Low Valuation for … the Wilshire Composite, the Bank of Shanghai, Oil, Gold, and Crypto is … 21 November 2023
All of the above asset classes - and the inverse for sovereign debt interests, i.e., interest rates have a major interim low ending 21 November 2023.
Will the crash devaluation for the above assets be 5, 10, 15, 20, 25%. or more from their current Sunday 12 November 2023 valuations? Time will tell. The Bank of Shanghai should have a 25-30 percent loss from its current valuation.
The asset-debt macroeconomic system, a product of human transaction self-orders the timing of its asset classes’ peak and secondary peak high and nadir low valuations and does in a mathematical fractal pattern just as the universe self orders its parts into structures at different size and time scales: with interaction of subatomic wave-particles; atomic elements; complex molecular organic chemicals; living cells, organelles and tissue within organisms; planetary, comet, and debris interactions within star systems, those systems and black holes within galaxies, and galaxies within the universe.
Underlying the self-assembly of the subcomponents within the size and time scales are the observed elegantly simple mathematical relationships and constants that allow reasonable predictions to be made about the past, ongoing and future interactions at the particular scale.
And so, for buying and selling human transactions of the Asset-Debt Macroeconomic System, more recently strongly influenced by central bank broad QE and QT, elegantly simple mathematical time-based fractal patterns are observed for the system’s self ordering of its asset classes high and nadir valuations.
There are only two time-based self-ordering fractal patterns: a three phase fractal pattern of x/2-2.5x/1.5-2.5x and a 4 phase fractal pattern of x/2-2.5x/2-2.5x/1.5-1.6x. Subfractal (3) 2-2.5x of the 4 phase fractal pattern can be a peak valuation in an asset=debt system whose worth is expanding such as the subfractal (3) 90 year peak valuation on 8 November 2021 of a US 1807 36/90/90/54 :: x/2.5x/2.5x/1.5 or it can be a low in system which is undergoing fractal decay which is the current Nov 2023 case with severe QT following in March 2022 after unprecedented QE in 2020.
Using quantum time based fractal progression using the two elegantly simple fractal laws of the asset-debt macroeconomic system listed above, the interim crash low for the Wilshire Composite, the Bank of Shanghai, Oil, Gold, and Crypto is predicted to be 21 November 2023 while the interim low long term sovereign interest rate(higher valuations for previously purchased US Notes and Bonds) is predicted to be 21 November 2023.
The below asset class images and their observed and predicted fractal time progression speak for themselves.


Thursday, November 2, 2023
THE GREAT NOVEMBER 2023 GLOBAL CRASH
The current fractal target date for the global intermediate crash low for equities, crypto, gold and commodities is 14 November 2023. This intermediate target date is based on two sequential monthly declining Bank of Shanghai equity 3-phase Lammert decay fractal series starting November 2017: 9/20/18 months and 9/21 of 21/12-18 months. A 27 June 2023 daily 4-phase Lammert fractal series of 14/34/28/21 days (ending 14 November 2023 ) completes a July 2021 9/21 month subfractal (1) and subfractal (2) series of a projected 9/21/12-18 month 3 phase decay fractal series.
With its collapsing overproduced by 100 % and grossly overvalued property sector, China has the overproduced and overproduced manufacturing position that the the United Staes had in 1929.
Lammert Fractals are deterministically self-ordered in the most elegantly efficient manner by the global asset-debt macroeconomic system and have two simple mathematical fractal grouping patterns: a 3-phase time-based fractal pattern of x/2-2.5x/1.5-2.5x and a 4-phase time-base fractal pattern of x/2-2.5x/2-2.5x/1.5-1.6x. Self similar fractal time units can be in minutes, hours, days, weeks, months and years. The 2-2.5x subfractal (3) of the 4-phase fractal pattern can be a peak such as the 90 year 8 November 2021 peak for the US 1807 36/90/90/54 year great fractal series or a nadir in a declining series. The fractal groupings are determined by the underlying trend line from the first and last time unit of the fractal grouping which means that the nadir valuations determine fractal groupings. the nadir valuation point for the 90 year subfractal (2) of the 1807 36/90/90/54 year Lammert 4-phase great US fractal series occurred on 8 July 1932.


 On 2 November 2023, selling and buying were conducted by the “smartest” speculators or AI programs. Equities were sold to those occupying the last musical chairs with gapped higher highs on 1 and 2 November. Conversely for the smart sellers of equities, long term US Notes and Bonds were purchased with exiting equity money with a gapped nonlinear low for Notes and Bonds on 2 November 2023 which was the trading day after the completion of a 31 August 2023 9/20/16 day lower high peak interest rate and an 11 October 2023 16 day subfractal (3) 3/8/7 day lower high peak interest rate. A gapped low occurred on day 17 of the 11 October subfractal (3) ending 2.5% lower of a projected 25 day lower low interest rate series.
 Updated 5 November 2023: A new fractal target for low valuation date for the global equity, gold, oil, crypto crash is 16 November 2023. Money exiting equities et. al. will flow into US longterm debt instruments driving interest rates lower.
 Gold, crypto, oil, the Shanghai property index, and the linked Bank of Shanghai all have expected lows on 16 November 2023.


Tuesday, October 24, 2023
Lammert Saturation Self Assembly Saturation Macroeconomics:Peak US Sovereign Interest Rates: 19-20 October 2023; Equities, Commodities,Gold Crash low: 2 November 2023
Within the 1807 US Hegemonic self-ordering Great 4-phase Fractal Series of 36/90/90/54 years ::x/2.5x/2.5x/1.5x with its 36 year subfractal (1) low in 1842-43; its 90 year subfractal(2) low on 8 July 1932, its 90 year subfractal (3) high on 8 November 2021 - an interpolated subfractal (1) and subfractal (2) of a 13/30 year fractal series began on 11-12 August of 1982. At the terminal portion of the 30 year subfractal (2) an interpolated monthly fractal series began in March 2020 with Covid QE near zero interest rates and massive money infusion and distribution. After a most austere central bank QT secondary to consumer price inflation, the fractal series has completed its x/2.5x/2-2.5x growth at 8/20/17 months.
 The final 3/6 month fractal series of the 17 month subfractal (3) is composed of a 13 March 2023 52/104-130 day subfractal(1) and subfractal (2) series ::x/2-2.5x. Today 25 October 2023(before trading Subfractal (2)has completed day 106 and is witin the 2x to 2.5x window of nonlinearity that 104 to 130.
  Lammert subfractal (2) asset valuation nonlinearity can occur with the 26-32 year and 104-130 day subfractal (2)'s windows of the 11-12 August 1982 and 13 March 2023subfractal(1) and subfractal(20 respective series.
 Within the last half of the 104 to 130 day subfractal (2), two sequential 4-hour unit 3 phase decay fractal series are identfied.
 Starting 130PM EST 18 October 2023 Subfractal(2) is expected to nonlinearly decline in 4/10/10 4-hour unit :: x/2.5x/2.5x fractal decay pattern completing subfractal (2) on the 113th day. ie. 2 November 2023.
All asset classes will undergo synchronous nonlinear devaluation to 2 November 2023 except held sovereign US debt which will rise in value (lower interest rates).
A 20/44/44 month :: x/2-2.5x/2-2.5x growth fractal series for Bitcoin in USD that started in January 2015 with a final lower high gapped peak on 24 October 2023 will undergo a crash devaluation. Cryptocurrencies (use GBTC as a proxy) have undergone a 26 September 2023 short squeeze blow-off of 4/10/8 days :: x/2.5x/2x with a gapped high today and likely ending on the low of the day. This blow-off series will convert to a crash devaluation series of 4/10/10/6 days. The final 6th day of this crypto fractal series is 2 November 2023 and coincides with the expected terminal day of a weekly 29 Sept 2021 gold fractal series of 15/38/37/22 weeks :: x/2.5x/2.5x/1.5x with the final 22 weeks composed of a 7 June 2023 15/37/33/22 days :: x/2.5x/2-2.5x/1.5x ending on 2 November 2023.
A Primer on the the Self-Assembly Time-scale Fractal Nature of the growth and decay of asset valuations within the deterministic asset-debt macroeconomic system:
There are only two elegantly simple laws of self-assembly time-based fractal asset-debt macroeconomics:
While money and credit growth (and contraction)by central banks and government spending is periodically irregular, the global asset-debt macroeconomic system intrinsically and deterministically sets the order (self-orders) the growth and decay of the ongoing valutions of its asset classes of equity and commodity and debt composites by only two distinct time-based fractal patterns(mathematical laws): a three phase pattern: composed of three subfractals:1/2/and 3 in the time-scaled mathematical fractal order of x/2-2.5x/1.5-2.5x – where x is the base first fractal (subfractal (1) whose self-similar time length in quatified in days, weeks, months, and years.
and a four phase pattern: composed of 4 subfractals: 1/2/3/ and 4 of the mathematical fractal pattern of x/2-2.5x/2-2.5x/1.5-1.6x, where x is the base first fractal {subfractal (1)} time length in days, weeks, months, and years. Subfractal(3) of the 4 phase fractal series pattern can be a peak valuation such as the 2.5x 90 year subfractal (3) on 8 November 2021 or a low valuation in a declining fractal series.
The time length of subfractal 2 (2-2.5x) of the 3 and 4 phase fractal series often determines the ideal time length of subfractal 1 : (x’) upon which the lengths of sub-fractals 3 and 4 are based: e.g., the 4 phase fractal pattern’s time lengths become x/(2-2.5x divided by 2.5 = x’)/2-2.5x’/1.5-1.6x’.
Starting 130PM EST 18 October 2023 Subfractal(2) is expected to nonlinearly decline in 4/10/10 4-hour unit :: x/2.5x/2.5x fractal decay pattern completing subfractal (2) on the 113th day. ie. 2 November 2023.
All asset classes will undergo synchronous nonlinear devaluation to 2 November 2023 except held sovereign US debt which will rise in value (lower interest rates).
A 20/44/44 month :: x/2-2.5x/2-2.5x growth fractal series for Bitcoin in USD that started in January 2015 with a final lower high gapped peak on 24 October 2023 will undergo a crash devaluation. Cryptocurrencies (use GBTC as a proxy) have undergone a 26 September 2023 short squeeze blow-off of 4/10/8 days :: x/2.5x/2x with a gapped high today and likely ending on the low of the day. This blow-off series will convert to a crash devaluation series of 4/10/10/6 days. The final 6th day of this crypto fractal series is 2 November 2023 and coincides with the expected terminal day of a weekly 29 Sept 2021 gold fractal series of 15/38/37/22 weeks :: x/2.5x/2.5x/1.5x with the final 22 weeks composed of a 7 June 2023 15/37/33/22 days :: x/2.5x/2-2.5x/1.5x ending on 2 November 2023.
A Primer on the the Self-Assembly Time-scale Fractal Nature of the growth and decay of asset valuations within the deterministic asset-debt macroeconomic system:
There are only two elegantly simple laws of self-assembly time-based fractal asset-debt macroeconomics:
While money and credit growth (and contraction)by central banks and government spending is periodically irregular, the global asset-debt macroeconomic system intrinsically and deterministically sets the order (self-orders) the growth and decay of the ongoing valutions of its asset classes of equity and commodity and debt composites by only two distinct time-based fractal patterns(mathematical laws): a three phase pattern: composed of three subfractals:1/2/and 3 in the time-scaled mathematical fractal order of x/2-2.5x/1.5-2.5x – where x is the base first fractal (subfractal (1) whose self-similar time length in quatified in days, weeks, months, and years.
and a four phase pattern: composed of 4 subfractals: 1/2/3/ and 4 of the mathematical fractal pattern of x/2-2.5x/2-2.5x/1.5-1.6x, where x is the base first fractal {subfractal (1)} time length in days, weeks, months, and years. Subfractal(3) of the 4 phase fractal series pattern can be a peak valuation such as the 2.5x 90 year subfractal (3) on 8 November 2021 or a low valuation in a declining fractal series.
The time length of subfractal 2 (2-2.5x) of the 3 and 4 phase fractal series often determines the ideal time length of subfractal 1 : (x’) upon which the lengths of sub-fractals 3 and 4 are based: e.g., the 4 phase fractal pattern’s time lengths become x/(2-2.5x divided by 2.5 = x’)/2-2.5x’/1.5-1.6x’.
 Above is the French stock market composite CAC's fractal pathway to the 2 Novemmer 2023 crash low.
 Added 940 AM EST 26 October.
A History of October 1987 Quantum Fractal Series:
The 1987 SPX and global crash occurred in the subfractal (2) 2-2.5x nonlinear devaluation widow of two interpolated
subfractal (1) and. subfractal (2) monthly fractal series. The first was a 20/45 of 46 months fractal series starting in July 1982 and the second an interpolated fractal series of 11/26 of 27 months fractal starting in November 1984.
Preceding the Sept-Oct 3 phase daily crash fractal series was a self-ordered 20 May 1987 4-phase 13/32/25/18 day :: x/2.5x/2x/1.5x fractal series ending 21 September 1987. The 4/9/10 day :: x/2-2.5x/2.5x 3-phase crash series occurred from 21 September to 19 October 1987 with a peak to nadir loss of 33%.
The SPX is again in the terminal 2x-2.5x nonlinear devaluation window of two subfractal(1) and subfractal (2)series: a 1982 13/30 year fractal series and a 13 March 2023 52/107 day fractal series. The crash daily decay fractal series appears to be a 27 September to 2 November 2023 5/12/12 day :: x/2-2.5x/2-2.5x series. At a 4-hour unit level the last 12 days appear to be following a 4/10/10 4-hour unit :: x/2.5x/2.5x 3-phase fractal decay series ideally ending around noon on the trading day of 2 November 2023. The greatest decline will likely occur in the last units of the final 10-unit sequence.
Below: Added 29 October 835 PM EST
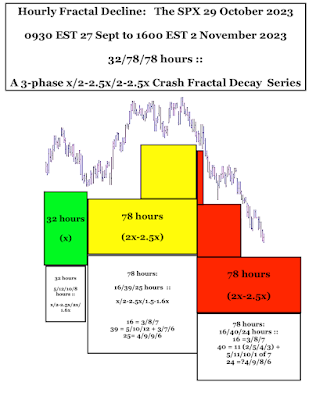
The 27 September 2023 32/78/78 hour :: x/2.5x/2.5x 3-phase fractal decay crash to the end of the trading day 2 November 2023
The final daily fractal decay sequence of a 13 March 2023 52/113 day :: subfractal (1) and subfractal (2) is a 3-phase series of 5+/12/12 days beginning on 27 Sept and ending 2 November 2023 (assuming no trading halts). On a hourly basis a 32.78/78 hour, 3- phase X/2.5x/2.5x decay fractal series is observed starting 0930 EST on 27 September 2023 and ending 400PM EST 2 November 2023.
Added 940 AM EST 26 October.
A History of October 1987 Quantum Fractal Series:
The 1987 SPX and global crash occurred in the subfractal (2) 2-2.5x nonlinear devaluation widow of two interpolated
subfractal (1) and. subfractal (2) monthly fractal series. The first was a 20/45 of 46 months fractal series starting in July 1982 and the second an interpolated fractal series of 11/26 of 27 months fractal starting in November 1984.
Preceding the Sept-Oct 3 phase daily crash fractal series was a self-ordered 20 May 1987 4-phase 13/32/25/18 day :: x/2.5x/2x/1.5x fractal series ending 21 September 1987. The 4/9/10 day :: x/2-2.5x/2.5x 3-phase crash series occurred from 21 September to 19 October 1987 with a peak to nadir loss of 33%.
The SPX is again in the terminal 2x-2.5x nonlinear devaluation window of two subfractal(1) and subfractal (2)series: a 1982 13/30 year fractal series and a 13 March 2023 52/107 day fractal series. The crash daily decay fractal series appears to be a 27 September to 2 November 2023 5/12/12 day :: x/2-2.5x/2-2.5x series. At a 4-hour unit level the last 12 days appear to be following a 4/10/10 4-hour unit :: x/2.5x/2.5x 3-phase fractal decay series ideally ending around noon on the trading day of 2 November 2023. The greatest decline will likely occur in the last units of the final 10-unit sequence.
Below: Added 29 October 835 PM EST
The 27 September 2023 32/78/78 hour :: x/2.5x/2.5x 3-phase fractal decay crash to the end of the trading day 2 November 2023
The final daily fractal decay sequence of a 13 March 2023 52/113 day :: subfractal (1) and subfractal (2) is a 3-phase series of 5+/12/12 days beginning on 27 Sept and ending 2 November 2023 (assuming no trading halts). On a hourly basis a 32.78/78 hour, 3- phase X/2.5x/2.5x decay fractal series is observed starting 0930 EST on 27 September 2023 and ending 400PM EST 2 November 2023.
 Added 29 October 2023: 838 EST The Global banking crash. Deutsche Bank.


Wednesday, October 11, 2023
Lammert Asset-Debt Quantum Fractal Saturation Macroeconomics: 6 October 2023 US Bond Interest Rate Peak; 31 October 2023 Wilshire Crash Low
A PRIMER ON LAMMERT QUANTUM FRACTAL GROWTH AND DECAY IN THE WORLD 1.3-1.5 QUADRILLION DOLLAR EQUIVALENT ASSET DEBT SYSTEM.
The beginning and ending boundaries of time based fractal series are defined by uptrend and downtrend lines with positive and negative slopes, respectively, that are formed by connecting the two low points at the beginning and the end of the fractal series.
In a bar chart, unit bars can be minutes, hours, days, weeks, months, and years. It is the hypothesis of this website that the asset debt macroeconomic system is deterministic and the growth and decay of the ongoing unit time valuations of its asset classes automatically self assembly in the most efficient manner with self similar fractal patterns of the unit time based bars.
There are only two elegantly simple laws of self-assembly time-based fractal asset-debt valuation growth and decay macroeconomics:
While money and credit growth (and contraction)by central banks and government spending is periodically irregular, equity and commodity composite valuations grow and decay by only two distinct time-based fractal patterns(mathematical laws):
a three phase pattern: composed of three subfractals:1/2/ and 3 :: x/2-2.5x/1.5-2.5x – where x is the base first fractal time length in days, weeks, months, and years.
and a four phase pattern: composed of 4 subfractals: 1/2/3/ and 4 :: x/2-2.5x/2-2.5x/1.5-1.6x, where x is the base first fractal time length in days, weeks, months, and years. In a four phase fractal series the sum of the length of subfractal 1 and 2 may be exceeded by the sum of the length of subfractal 3 and 4 by 0.1x.
The time length of subfractal 2 (2-2.5x) of the 3 and 4 phase fractal series often determines the ideal time length of subfractal 1 : (x’) upon which the lengths of sub-fractals 3 and 4 are based: e.g., the 4 phase fractal pattern’s time lengths become x/(2-2.5x divided by 2.5 = x’)/2-2.5x’/1.5-1.6x’.
The US Hegemony macroeconomic system is following an 1807 4 phase fractal series of 36/90/90/54 years with a 90 year Subfractal 3 high on 8 November 2021 for for the Wilshire and Bitcoin/USD. Smaller unit time based fractal series make up the 36,90,90 and upcoming 54 years.
8 November 2021 represented the peak valuation for the US (then) 48.95 trillion dollar Wilshire equity index composite.While this date was not prospectively predicted by fractal analysis for the self-assembly asset-debt system,it represented a x/2x/2x :: 31/62-63/62-63 monthly growth from the March 2009 low and a 36/90/90 year :: x/2.5x/2.5x growth from the US hegemony low starting in 1807.
Interest rates for US sovereign long term Notes and Bonds have been declining in a cascading manner since the Volcker peak of September 1981 with a series of lower high interests preceded by lower lows.The last cycle starting at its low for the US Bond market began in December 2008 at 2.61% after the 3 October 2008 Emergency Stabilization Act and the preceding housing bubble induced Lehman Brother’s implosion. The US 30 year Bond’s cascadingly lower highs and lower low interest rates were propelled by post 2009 QE programs and post covid MBS’s and resulted in another lower low in April 2021 at 1.17%. With covid checks exceeding annual wages and resulting in 2 trillion dollars of savings and with low MBS mortgage rates of less than 3.5 % (and significantly less for the Blackstone-like financial industry mortgage acquirers), the new credit and money resulting inflation caused blow-off fractal growth of interest rates with a peak 30 Bond interest rate of 5.053% occurring on 6 October 2023.
Do Debt Market valuation follow Lammert quantum fractal patterns?
The following monthly, weekly, daily fractal series represent Bond interest rate growth rather than previously purchased bonds’ ongoing converse valuation decay. These two entities are the (near exact) inverse mirror valuations of each other. Bonds purchased in April 2021 at a 1.17% yield are, as of 6 October 2023, currently worth only about 22 – 24% of their purchase value.
Do US Bond interest rates undergo the Asset-Debt macroeconomic system’s quantum fractal self-assembly?
Since the March April 2020 low, 30 Year US Bond interest rate growth has occurred in two monthly fractal series: 7/16/16 months and 2/4/4 months reaching its peak on 6 October 2023. The last 2/4/4 fractal series . represents a blow-off x/2x/2x growth fractal series.
The final 2/4/4 month fractal series starting 6 April 2023 is a 5/12/12 week series ending 6 October 2023.
Three Blow-off higher high exhaustion gaps occur in the terminal 13 days
The final 12 weeks of the 5/12/12 week series starts on 19 July 2023 and is self assembled into three Lammert fractal series: a 4 phase series of 5/12/10/8 days :: x/2.5x/2x/1.6x; a three phase series of 3/7/6 days :: x/2-2.5x/2x with a higher high exhaustion gap between the second and third (three phase) fractal series of 3/6/6 days :: x/2x/2x with a higher high exhaustion gap between day 1 and day 2 of the 6 day subfractal two and a higher high exhaustion gap between day 2 and day 3 of the final 6 day subfractal 3.
The peak of bond market interest rates is within a few weeks of the final lower lower high of equity valuations before the nonlinear October 2023 crash devaluation.. Money exiting from equities will drive interest rates cascadingly lower and ultimately lower than the April 2021 1.17% low.
The projected major self-assembly major quantum interim fractal low for global equities is 31 October 2023.
Based on the Bank of the Shanghai monthly, weekly and daily quantum fractal patterns, the projected major interim fractal low for global equities, commodities and cryptocurrencies is 31 October 2023 and final low Jan-March 2025.
For the Wilshire composed from its 18 August 2023 low, the current working fractal model is (2) sequential 3-phase Lammert fractal decay series of 6/12/12 days ending 27 September 2023 followed by and starting on 27 September 2023, a 5/12/10 day 3-phase crash fractal decay series ending 31 October 2023. The final lower low is expected September October 2024.
Money exiting the collapsing US stock market will drive US Bond interest rates cascadingly to lower lows and eventually lower than the April 2021 1.17% low.
 Update 22 October 2023:
The peak fractal growth for US 10 year Notes and 30 year Bonds was previously projected for 6 October 2023 but empirically reached a higher peak on 19 October 2023. With US equities reaching a 13 March 2023 11/22 week and 52/104 day subfractal (1) and subfractal (2) lower high valuation and a March 2020 8/18/20 month lower high valuation before the 5/12/3 of 10 day fractal collapse to 31 October 2023, what is the fractal growth of interest rates of US Notes and Bonds (an exact inversion of previously purchased debt valuation worth) since the Covid low interest rate valuation in March 2020?
Qualitatively after massive Covid money creation and near zero interest rate debt created consumer inflation, central banks have, countervailingly, raised interest rates.
The monthly fractal blow-off growth in long term US sovereign interest rates has occurred in two monthly fractal series as depicted below: 7/16/17 months :: x/2-2.5x/2-2.5x followed by 2/4/3 months :: x/2x/1.5x. A final peak 1.5x growth, ie, 3months can be an interpolated part of a larger 3-phase x/2x/2x-2.5x fractal decay series or part of a 4-phase x/2x/2-2.5/1.6x series.
The last 2/4/3 month fractal series in this fractal growth progression can be observed on a daily fractal basis as 21/52/32 days : x/2.5x/1.5x followed by 14/21 days ::x/1.5x with a peak 10 year Note interest rate on 19 October 2023. see below.
Update 22 October 2023:
The peak fractal growth for US 10 year Notes and 30 year Bonds was previously projected for 6 October 2023 but empirically reached a higher peak on 19 October 2023. With US equities reaching a 13 March 2023 11/22 week and 52/104 day subfractal (1) and subfractal (2) lower high valuation and a March 2020 8/18/20 month lower high valuation before the 5/12/3 of 10 day fractal collapse to 31 October 2023, what is the fractal growth of interest rates of US Notes and Bonds (an exact inversion of previously purchased debt valuation worth) since the Covid low interest rate valuation in March 2020?
Qualitatively after massive Covid money creation and near zero interest rate debt created consumer inflation, central banks have, countervailingly, raised interest rates.
The monthly fractal blow-off growth in long term US sovereign interest rates has occurred in two monthly fractal series as depicted below: 7/16/17 months :: x/2-2.5x/2-2.5x followed by 2/4/3 months :: x/2x/1.5x. A final peak 1.5x growth, ie, 3months can be an interpolated part of a larger 3-phase x/2x/2x-2.5x fractal decay series or part of a 4-phase x/2x/2-2.5/1.6x series.
The last 2/4/3 month fractal series in this fractal growth progression can be observed on a daily fractal basis as 21/52/32 days : x/2.5x/1.5x followed by 14/21 days ::x/1.5x with a peak 10 year Note interest rate on 19 October 2023. see below. The 14/21 day :: x/1.5x peak interest rate valuation then collapses as global money – from the 13 March 2023 22 week and 1994 30+ year subfractal (2)’s 2x-2.5x US windows of nonlinear collapsing valuation- enters the US sovereign debt market and drives interest rates lower. The 14/21 day :: x/1.5x becomes an interpolated part of a 3-phase 14/29-35/28-35 day decay series or part of a 4-phase 14/29-35/28-35/22 day decay series.
 Added 23 October 2023 809PM EST:
On a four hour unit fractal basis, a 8/18/20 month Wilshire and Global crash low will occur in the afternoon of 31 October 2023 with a lower low in Sept-Oct 2024. (see graph below)
27 September 2023 Wilshire 4-hour unit 3-phase fractal decay series 10/22/20 units
0930 EST 27 September to 1330 EST 3 October 10 units
1330 EST 3 October to 0930 EST 18 October 22 units
0930 EST 18 October to 1330 EST 31 October 20 units
At the close of today the 18-31 October series is 4/5 of 9/9 4-hour units.
Added 23 October 2023 809PM EST:
On a four hour unit fractal basis, a 8/18/20 month Wilshire and Global crash low will occur in the afternoon of 31 October 2023 with a lower low in Sept-Oct 2024. (see graph below)
27 September 2023 Wilshire 4-hour unit 3-phase fractal decay series 10/22/20 units
0930 EST 27 September to 1330 EST 3 October 10 units
1330 EST 3 October to 0930 EST 18 October 22 units
0930 EST 18 October to 1330 EST 31 October 20 units
At the close of today the 18-31 October series is 4/5 of 9/9 4-hour units.


Sunday, June 11, 2023
THE WILSHIRE’S MARCH 2020 HISTORICAL SEQUENTIAL QE/QT TWO PHASE SELF ASSEMBLY PROCESS COMPOSED OF TWO FRACTAL SERIES: 15/37/31 WEEKS AND 18/38/40-41 WEEKS, RESPECTIVELY; THE WILSHIRE’S 1/13/2023 FINAL X/2.5X/2.5X ::12/27/26-27 DAY BLOW-OFF VALUATION FRACTAL GROWTH SERIES 11 JUNE 2023
Since its March 2020 Covid low valuation, the Wilshire’s valuation growth has been stimulated by unprecedented global central bank historical QE money and MBS credit creation and followed and limited thereafter by historical QT tightening.
Near annual money supply increased by 25% and thereafter decreased by 4.5 %. These extremes of money/credit creation and contraction caused the self assembly of two sequential fractal series in the global hegemony’s composite Wilshire: a growth series of15/37/31 weeks and a reflexive growth, decay, final growth and decay series of 18/38/40-41 weeks.
This website has attempted to show that global equity and commodity valuations – under the umbrella of supply and demand of property, goods, and credit and more recently of greater central bank influence and manipulation of money and credit supply – grow and decay in elegantly simple well defined optimal self-assembly time based quantitative fractal patterns.
From its March 2020 low valuation, the Wilshire’s valuation grew in a rapid first phase 15/37/31 week :: x/2.5x/2x QE fashion, followed by a second QT phase of final growth, decay, and secondary growth fashion in a September 2021 18/38/35 of 35-36 week to peak secondary growth fractal series of x/2-2.5x.2x , and collapsing in the final 5 weeks of a composite 18/38/40-41 week decay series: y/2-2.5y/2-2.5y.
The September 2021 18 week base fractal was composed of a 3/8/6/4 fractal series. The 38 week second fractal was composed of a 7/15/18 week series. The third 35-36 week fractal to final growth valuation was composed of two growth series 4/8/8/5 weeks and 3/7/6-7 weeks.
The final 1/13/2023 12/27/26-27 day :: x/2.5x/2.5.x growth pattern, composing the 3/7/6-7 week fractal series, matches an 1807 x/2.5x/2.5x :: 36/90/90 year series peaking November 8,2021.
This November 2021 peak was the 37 week of a 37 week third fractal of an interpolated 15/37/37 week :: x/2.5x/2.5x fractal series from the March 2020 low. and week 5 of the second 8 week fractal of the September 2021 18 week base composed of a 3/8/6/4 week series.
The gapped higher high blow-off of the 1/13/2023 final growth series occurred between 5/31/2023 and 6/2/2023 and can currently be seen on a monthly basis between month 9 and 10 (May and June 2023) of an interpolated September 2021 4/10/10 month reflexive growth/decay/final growth series.
A nonlinear second fractal 2x-2.5x valuation decay ending would fit an interpolated 1981-1982 13/29-32 year first and second fractal series :: x/2-2.5x.
Saturday, April 29, 2023
The March 2020 28/70/67 of 70 Week May 2023 Global (non debt) Asset Crash Devaluation
Over the next 3 weeks and 15 trading days, basic use and precious metal commodity prices, cryptocurrencies, and global equities will undergo a severe crash devaluation reflecting both the historical money supply increase in the covid QE period and the subsequent consumer inflation central bank QT response with historical draconian money supply contraction. Only in the 1930s has money contraction occurred to this degree.
An average total asset growth and decay series from the March 2020 low of 28/70/67 of 70/42 weeks :: x/2.5x/2.5x/1.5x is undergoing self-assembly.
This will complete the first and second fractal of an interpolated 1982 13/31/31-32/20-19 years series, which is part of the US hegemonic 1807 36/90/90/54 year series with a low in 1842/43, a low in 1932, and a third fractal high valuation in November 2021.
Expect rapid lowering of Fed Funds interest rates after the crash.
Saturday, March 18, 2023
THE 1982 13/31-33 YEAR :: NONLINEAR END OF THE 1994 31-33 YEAR SECOND FRACTAL: THE TERMINAL DAILY 12 OCT 2022 TO 25 MAR 2023 4 PHASE FRACTAL SERIES: 17/28/36/25 DAYS :: X/2-2.5X/2-2.5X/1.5X
The Asset-Debt Macroeconomic system is deterministic and Its valuation growth and decay cycles are self-assembled in the most efficient manner and in highly ordered time-based fractal patterns.
The two time based fractal patterns are a 3 phase cycle: x/2-2.5x/1.5-2.5x and a 4 phase cycle: x/2-2.5x/2-2.5/1.4-1.6x. Cycle lengths are determined by absolute or average valuation nadirs for a given time unit. The exception is the third subcycle (fractal) of the 4 phase cycle where the peak or lower high valuation determines the third subcycle's 2-2.5x time length.Longer term cycles of asset valuation growth and decay (yearly, quarterly, monthly) are created by credit and debt expansion followed by asset valuation decay via credit tightening and/or by bad debt liquidation/restructuring. Shorter time-based cycles (monthly, weekly, daily, hourly, minutely) self-assemble by saturation peak buying followed by saturation selling. The hallmark of long term second fractals (second sub-cycles) of 4 phase cycles is nonlinear devaluation and gapped lower low valuations. Shorter cycles are components of the longer cycles, and a 3 or 4 phase daily or weekly cycle may be at or near the the end of a longer (yearly) cycle with nonlinearity at the end of the 3rd or 4th subcycle of the shorter 3 and 4 phase cycles, respectively.
The US Hegemony's Great 4 Phase 1807 36/90/90/54 year :: x/2.5x/2.5x/1.5x Asset/Debt Macroeconomic Fractal Series
The US hegemony is undergoing a self assembly 4 phase 1807 36/90/90/54 year :: x/2.5x/2.5x/1.5x Asset/Debt Macroeconomic Great Fractal Series ending in 2074 with nadir valuation lows in 1842/43, 1932, and 2074 and a 90 year third fractal high in November 2021. 1932 represented the end of the second subcycle of this 267 year 4 phase Great Fractal series with a 90% 1929 peak to nadir devaluation. The second fractal valuation nonlinearity was profound.
The 1982 Interpolated 13/31-33/31-33/18-20 year Fractal Series
From 1932 A three phase 10-11/21/21 year :: x/2x/2x series brought the asset-debt system to 1982. In 1981 and 1982 interest rates were raised to 18-21% to control consumer based inflation. This resulted in significant business contraction with unemployment at 10 percent near the end of 1982. As interest rates dropped from their 1980-81 peaks, gains from previously held bonds entering equities offset a marked correction in equity valuations.1982 first 13 year fractal spanned from 1982 to 1994 and was composed of a 3/7/5 year ::x/2-2.5x/1.6x 3 phase fractal series. The 31-33 year second fractal contains two subseries. The first subseries was a 3/8/7 year fractal ending in 2009 containing credit expansions and collapses of the 2000 internet bubble and the 2007-8 housing bubble. The second series is more complicated with long periods of credit expansion and near zero interests and other QE programs punctuated with QT in 2018 and 2019. This was terminated with a Covid related unemployment spike to 13-14 %, which was offset by the greatest QE and money expansion program in history with free payments from the government that often exceeded working salaries. From the nadir in 2009, the monthly fractal patterns for equities were 5/13/10/7; 3/8/6; 8/17/17; 10/26/16; and 8/18/13 of ?13; all following the 4 phase and 3 phase fractal patterns. 6 May 2010 showed single day second fractal nonlinearity with the crash devaluation occurring between month 10 and 13: 2 and 2.5x with a March 2009 base first fractal of 5 months. This daily second fractal crash was similar to the 19 October 1987 crash occurring at month 26 with a base fractal of 11 months.The March 2020 monthly fractal series has been under an umbrella of both extraordinary credit expansion by the central bank resulting in double digit monthly consumer inflation followed by an extraordinary acceleration in Fed Funds rate increases, decreasing the paper value of US debt instruments held by banks by 600 billion and likely several hundred billion of corporate bonds.
What are the similarities between the inflationary situation in 1980-82 and the end 2021-23?
In the ten to fifteen years following 1980 1500 commercial and savings banks and 1200 savings and loans failed, representing about 30% of all institutions. Bad real estate loans on overvalued property were the principal cause. Current valuations of real estate in terms of wages are not that far off. The total US debt to GDP in 1980 was about 180% whereas today it is about 360% with federal debt having grown from 30 to 120% GDP. It would appear that the difference between the two periods is one of scale. Banking collapses which were part of the post 1980 economic scenario with interest rate hikes affecting loans on overvalued real estate have started in an explosive fashion affecting 'overvalued' bonds and other overvalued asset classes dependent upon easy credit and excessively low interest rates that have encouraged speculation and discouraged savings.
The Wilshire fractal self assembly anatomy of a 25 March 2023 nonlinear final low (or major low)
A potential x/2-2.5x/1.6x :: March 2020 8/18/13 of 13 month fractal series would be a proportional replica of the preceding 10/26/16 month fractal series. The final 13 month (third fractal) is composed of a 3/6/6 month 3 phase fractal series correlating to a 10/23/23 of 24 week fractal series. The final 24 weekly series starts with the low in October 2022 and is composed of 4/9/8/5 of 6 week 4 phase x/2-2.5x/2-2.5x/1.5x series. From the Wilshire's average daily low valuation on 12 October 2022, the 4/9/8/6 weeks series corresponds to a 17/38/36/25 day series with day 38 of the second fractal representing the average low valuation on 28 December 2022. The 36 day third fractal lower high valuation occurred on 17 February 23. The 25 fourth fractal is composed of two saturation trading subseries. The first is a 2/4/4 day fractal series ending on 1 March 2003. The second is a 3/7/6-7/5-4 series ending on 25 March 2023.
Will a nonlinear devaluation occur near the end of this 17/38/36/25 day fractal series which is contained within the 1994's 31-33 year second fractal terminal 2x-2.5x window of 26- 33 years of the 13 year x 1982 first fractal base?
Time will tell.
Tuesday, February 21, 2023
THE 1981 13(-)/31 :: X/2.5X MACROECONOMIC SYSTEM’S GREAT 21 FEBRUARY TO 31 MARCH 2023 NONLINEAR DEVALUATION
Contained within the US Hegemony’s 1807 36/90/90 /54 Year Fractal Series :: x/2.5x/2.5x/1.5x with lows in 1842/43 and 1932 and a 90 year high in 2021 is an interpolated first and second fractal series of 13 minus/31 years :: x/2-2.5x starting in 1981. The first base fractal was composed of a 3/7/5 years series and the second 31 year fractal composed of two sub fractals: 3/7-8/7 and 3/6/6/4 of 4 years.
The total global expanding/contracting money/debt creation supply supports asset creation and asset valuation. That supply is being QT’ed in a historically unprecedented fashion. Whipsaw QE/QT operations wlll continue during the US’s 54 year Fourth Great Fractal to combat asset valuation declines with countervailing consumer inflation.
Look to Gold in USD for the conclusion of the 13/31 year cycle with similar nonlinear devaluations in global equities, commodities, and crypto.
Gold from its monthly low: 13/32/26/ 19 of 20 months.
From gold in USD’s recent 29 day base fractal 29(x)//(19/46 = 64 = 2.5x’, ideal base x’ = 26 days)//1.5x’ = 39 days.
From gold’s peak 12 day base fractal 3/7/4 days; 12//25(5/11/11)/15 3/7/7 days :: x/2-2.5x’/1.5x’ ending 31 March 2023 …
For US equities A March 2020 x/2.5x/2x ::28/70/56 week peak is being concluded by a 4/9/8-9/1-2 of 6 week :: x/2-2.5x/2-2.5x/1.5x fractal series ending near 31 March 2023 with a daly series of 18/38/36/27 days.
Expect historical asset nonlinear devaluation.
Subscribe to:
Posts (Atom)